Tidy summarizes information about the components of a model. A model component might be a single term in a regression, a single hypothesis, a cluster, or a class. Exactly what tidy considers to be a model component varies across models but is usually self-evident. If a model has several distinct types of components, you will need to specify which components to return.
Usage
# S3 method for class 'binDesign'
tidy(x, ...)
Arguments
- x
A
binGroup::binDesign()object.- ...
Additional arguments. Not used. Needed to match generic signature only. Cautionary note: Misspelled arguments will be absorbed in
..., where they will be ignored. If the misspelled argument has a default value, the default value will be used. For example, if you passconf.lvel = 0.9, all computation will proceed usingconf.level = 0.95. Two exceptions here are:
See also
Other bingroup tidiers:
glance.binDesign(),
tidy.binWidth()
Value
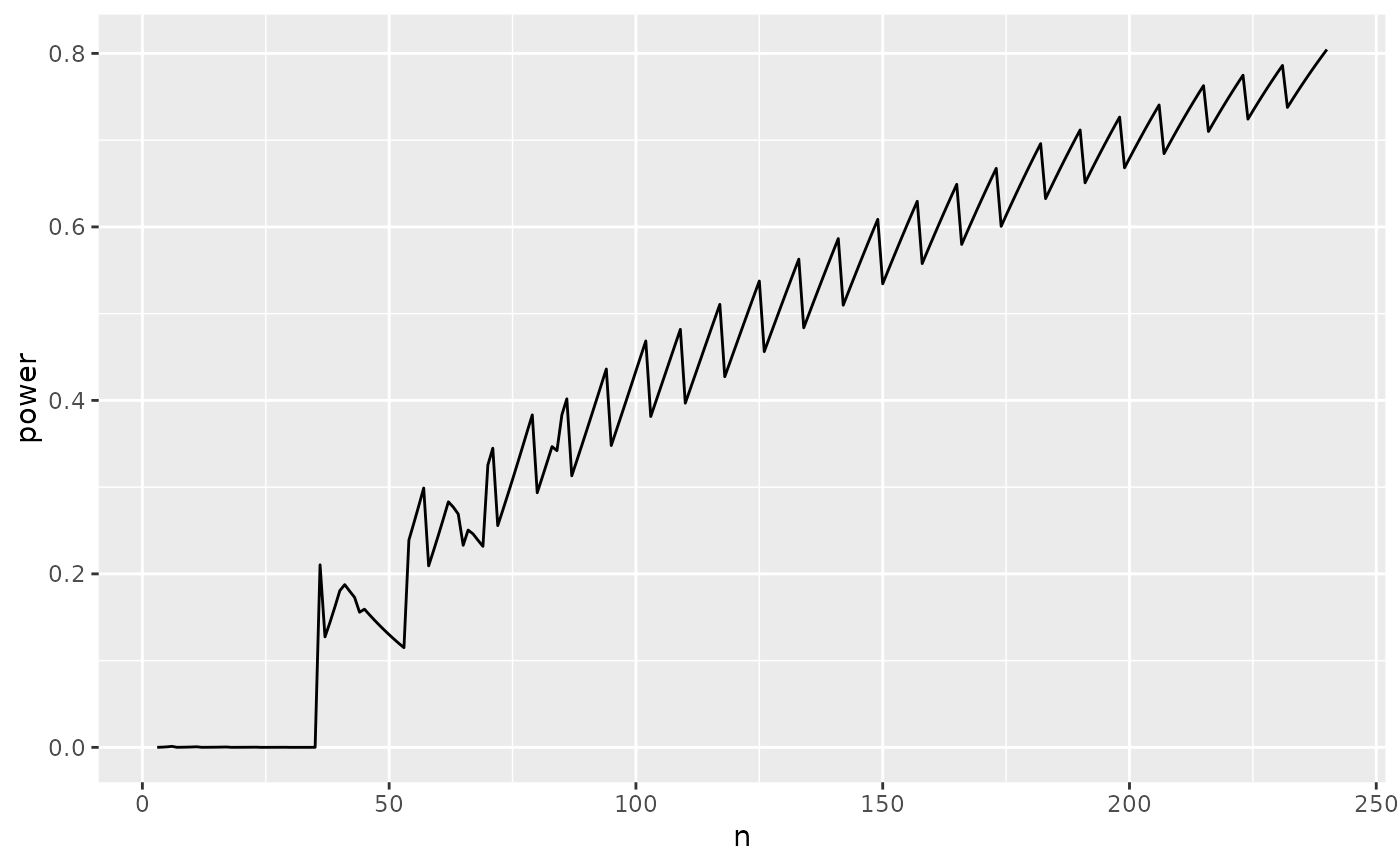
A tibble::tibble() with columns:
- n
Number of trials in given iteration.
- power
Power achieved for given value of n.
Examples
library(binGroup)
des <- binDesign(
  nmax = 300, delta = 0.06,
  p.hyp = 0.1, power = .8
)

glance(des)
#> # A tibble: 1 × 4
#>   power     n power.reached maxit
#>   <dbl> <int> <lgl>         <int>
#> 1 0.805   240 TRUE            238
tidy(des)
#> # A tibble: 238 × 2
#>        n     power
#>    <int>     <dbl>
#>  1     3 0.0000640
#>  2     4 0.000248
#>  3     5 0.000602
#>  4     6 0.00117
#>  5     7 0.0000813
#>  6     8 0.000157
#>  7     9 0.000274
#>  8    10 0.000443
#>  9    11 0.000673
#> 10    12 0.0000640
#> # ℹ 228 more rows

# the ggplot2 equivalent of plot(des)
library(ggplot2)
ggplot(tidy(des), aes(n, power)) +
  geom_line()