Tidy summarizes information about the components of a model. A model component might be a single term in a regression, a single hypothesis, a cluster, or a class. Exactly what tidy considers to be a model component varies across models but is usually self-evident. If a model has several distinct types of components, you will need to specify which components to return.
Usage
# S3 method for class 'nls'
tidy(x, conf.int = FALSE, conf.level = 0.95, ...)
Arguments
- x
An
nlsobject returned fromstats::nls().- conf.int
Logical indicating whether or not to include a confidence interval in the tidied output. Defaults to
FALSE.- conf.level
The confidence level to use for the confidence interval if
conf.int = TRUE. Must be strictly greater than 0 and less than 1. Defaults to 0.95, which corresponds to a 95 percent confidence interval.- ...
Additional arguments. Not used. Needed to match generic signature only. Cautionary note: Misspelled arguments will be absorbed in
..., where they will be ignored. If the misspelled argument has a default value, the default value will be used. For example, if you passconf.lvel = 0.9, all computation will proceed usingconf.level = 0.95. Two exceptions here are:
See also
tidy, stats::nls(), stats::summary.nls()
Other nls tidiers:
augment.nls(),
glance.nls()
Value
A tibble::tibble() with columns:
- conf.high
Upper bound on the confidence interval for the estimate.
- conf.low
Lower bound on the confidence interval for the estimate.
- estimate
The estimated value of the regression term.
- p.value
The two-sided p-value associated with the observed statistic.
- statistic
The value of a T-statistic to use in a hypothesis that the regression term is non-zero.
- std.error
The standard error of the regression term.
- term
The name of the regression term.
Examples
# fit model
n <- nls(mpg ~ k * e^wt, data = mtcars, start = list(k = 1, e = 2))

# summarize model fit with tidiers + visualization
tidy(n)
#> # A tibble: 2 × 5
#>   term  estimate std.error statistic  p.value
#>   <chr>    <dbl>     <dbl>     <dbl>    <dbl>
#> 1 k       49.7      3.79        13.1 5.96e-14
#> 2 e        0.746    0.0199      37.5 8.86e-27
augment(n)
#> # A tibble: 32 × 4
#>      mpg    wt .fitted .resid
#>    <dbl> <dbl>   <dbl>  <dbl>
#>  1  21    2.62    23.0 -2.01
#>  2  21    2.88    21.4 -0.352
#>  3  22.8  2.32    25.1 -2.33
#>  4  21.4  3.22    19.3  2.08
#>  5  18.7  3.44    18.1  0.611
#>  6  18.1  3.46    18.0  0.117
#>  7  14.3  3.57    17.4 -3.11
#>  8  24.4  3.19    19.5  4.93
#>  9  22.8  3.15    19.7  3.10
#> 10  19.2  3.44    18.1  1.11
#> # ℹ 22 more rows
glance(n)
#> # A tibble: 1 × 9
#>   sigma isConv     finTol logLik   AIC   BIC deviance df.residual  nobs
#>   <dbl> <lgl>       <dbl>  <dbl> <dbl> <dbl>    <dbl>       <int> <int>
#> 1  2.67 TRUE   0.00000204  -75.8  158.  162.     214.          30    32

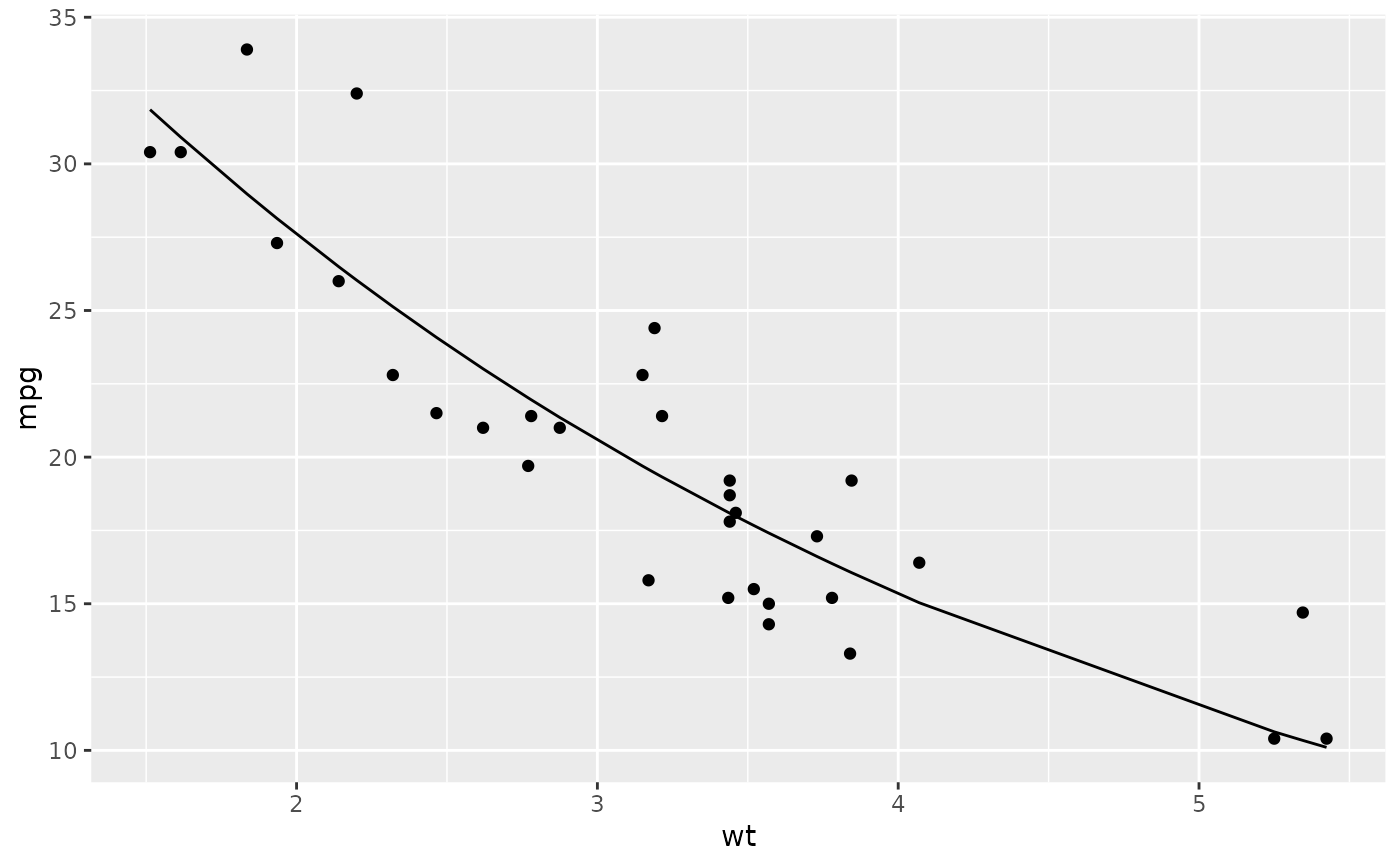
library(ggplot2)

ggplot(augment(n), aes(wt, mpg)) +
  geom_point() +
  geom_line(aes(y = .fitted))


newdata <- head(mtcars)
newdata$wt <- newdata$wt + 1

augment(n, newdata = newdata)
#> # A tibble: 6 × 13
#>   .rownames   mpg   cyl  disp    hp  drat    wt  qsec    vs    am  gear
#>   <chr>     <dbl> <dbl> <dbl> <dbl> <dbl> <dbl> <dbl> <dbl> <dbl> <dbl>
#> 1 Mazda RX4  21       6   160   110  3.9   3.62  16.5     0     1     4
#> 2 Mazda RX…  21       6   160   110  3.9   3.88  17.0     0     1     4
#> 3 Datsun 7…  22.8     4   108    93  3.85  3.32  18.6     1     1     4
#> 4 Hornet 4…  21.4     6   258   110  3.08  4.22  19.4     1     0     3
#> 5 Hornet S…  18.7     8   360   175  3.15  4.44  17.0     0     0     3
#> 6 Valiant    18.1     6   225   105  2.76  4.46  20.2     1     0     3
#> # ℹ 2 more variables: carb <dbl>, .fitted <dbl>
